
MARKET STATISTICS
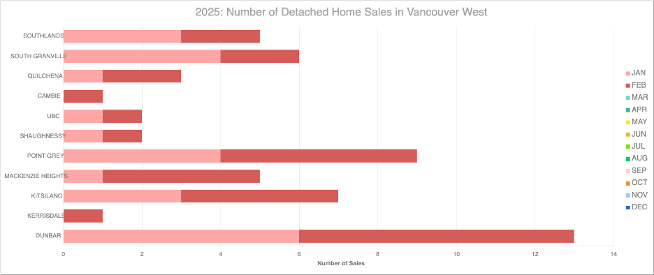
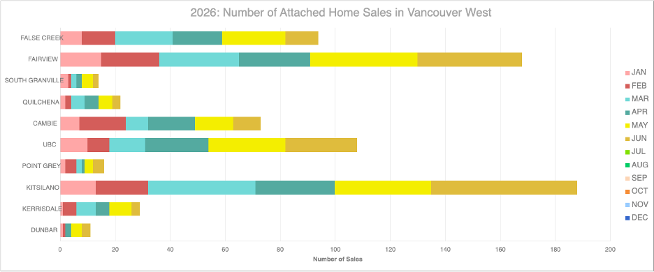
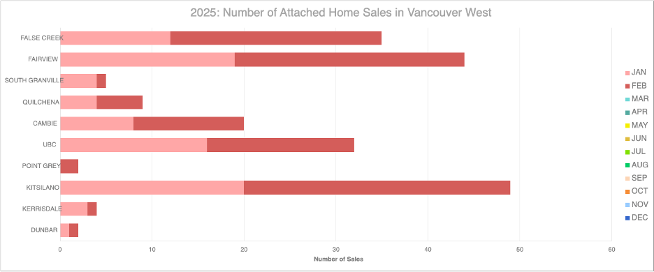
The following numbers have been obtained from www.rebgv.org and generated into the following graphs:


The below links are the Real Estate Board's monthly statistic package, which focused on Greater Vancouver as a whole and helps explains the current trends in the market:
2026: JAN | FEB | MAR | APR | MAY | JUN
2025: JAN | FEB | MAR | APR | MAY | JUN | JUL | AUG | SEP | OCT | NOV | DEC
2024: JAN | FEB | MAR | APR | MAY | JUN | JUL | AUG | SEP | OCT | NOV | DEC
2023: JAN | FEB | MAR | APR | MAY | JUN | JUL | AUG | SEP | OCT | NOV | DEC
2022: JAN | FEB | MAR | APR | MAY | JUN | JUL | AUG | SEP | OCT | NOV | DEC
2021: JAN | FEB | MAR | APR | MAY | JUN | JUL | AUG | SEP | OCT | NOV | DEC
2020: JAN | FEB | MAR | APR | MAY | JUN | JUL | AUG | SEP | OCT | NOV | DEC
For more statistics please visit Real Estate Board of Greater Vancouver.
QUICK LINKS | |
CONTACT US | ||||||||||||||||||
 Andrea Kavanagh PREC*
 Natalie Taylor PREC*
 Jolanta Proczek PREC*
-236-wide.png) Adrienne Avery
*Personal Real Estate Corporation
| ||||||||||||||||||


FEATURED LISTING |

$729,000 Spacious 2bdrm 1.5 bath townhome offering 1,215 sqft of thoughtfully designed living over 2 levels. Nestled in the quiet sought-after Montecito neighbourhood, ideally located near... RE/MAX Select Properties
|
